in Danish
Adobe recently updated how calculated metrics are build, managed and used in the Adobe Marketing Cloud. Not only did the update include new features and functionalities such as statistical calculations or the opportunity to share calculated metrics across report suites, it also improves the workflow for analysts deploying and using calculated metric in his or her daily work.
In the past only Adobe Ad Hoc Analytics has allowed analysts to use segments and a range of mathematic functions in calculated metrics. That has allowed analysts to do metrics comparison for segments in a single view when analysing data.
However, this has only been available in Ad Hoc Analytics and not in Analytics itself when setting up dashboard for your organisation etc.
With the changes to calculated metrics, analysts can now compare segmented metrics in a single view when setting up dashboard or reports directly in Analytics.
Let’s start looking at the new interface, by setting up a few useful metrics.
Mobile vs. Desktop visits or visitors
Knowing the share of mobile traffic to you site and being able to follow that over time, has previously required you to either setup 2 reports and then did the math yourself. Alternatively, you could setup an Excel report using Report Builder, and the have Excel to do the math for you.
Now you can build a metric showing you the share directly in Adobe Analytics or in your dashboards.
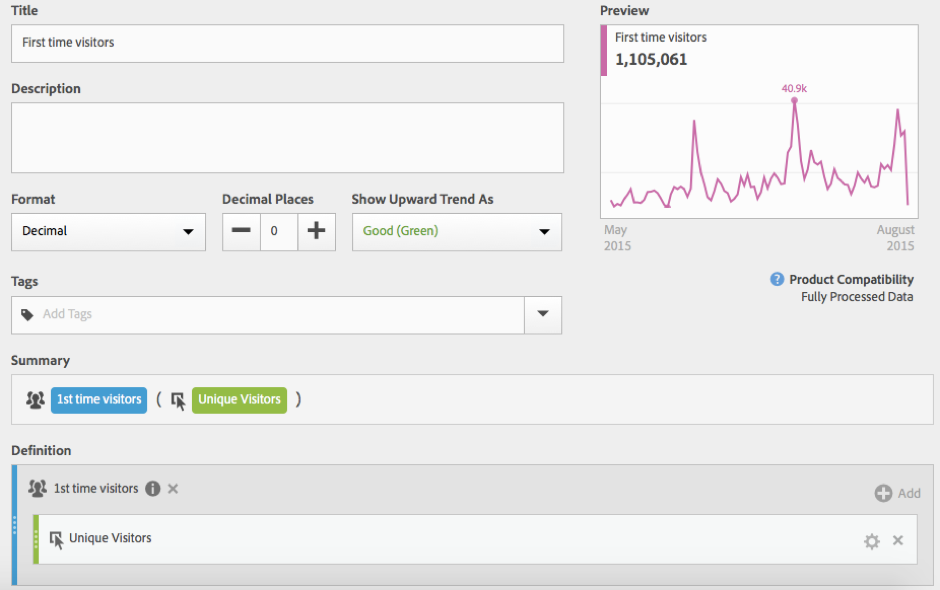
The new metric builder looks like this:
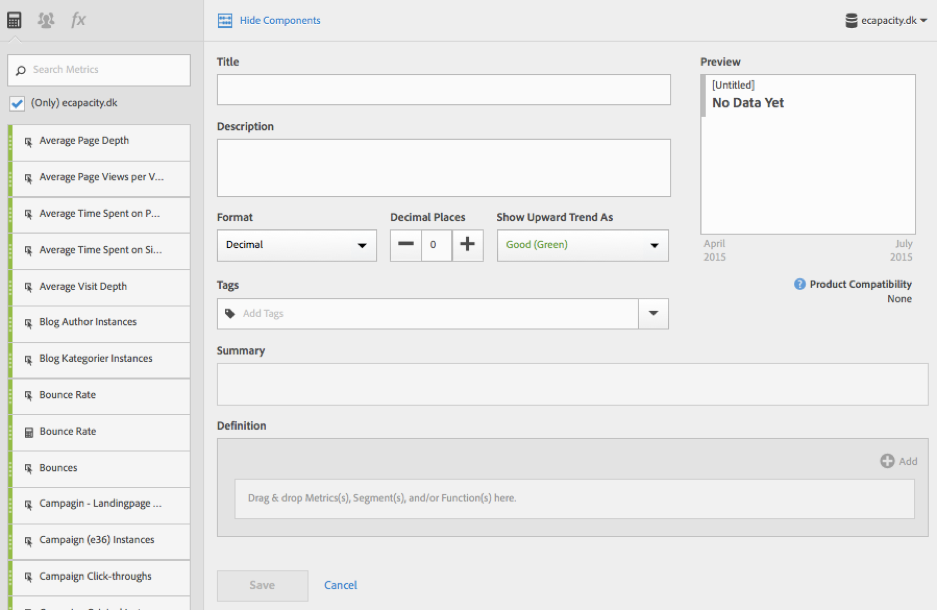
In the left side menu, you can find all your current metrics (included calculated), segments and mathematic functions.
In the main area of the metric builder, you can adjust the settings for the new metric such as what format, how many decimals and if an increasing trend in this metric is good or bad. You also have a preview of the data for the metric you are building and then of cause the actual metric definition at the bottom.
Calculated metrics are still build upon a single Report Suite, but they are available across all suites. Be aware of when you have multiple report suites with a different variable map, that isn’t something that is taken into account when using calculated metrics across different suites.
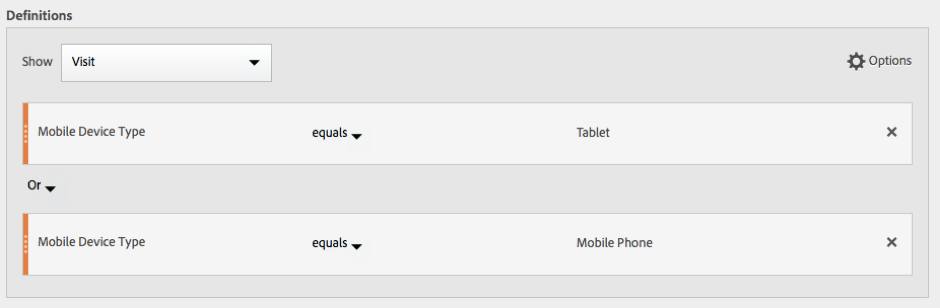
To create a calculated metric showing you only mobile traffic, you first need to build a segment identifying traffic from mobile devices. If you don’t already have made one, create a new segment with the following definitions.
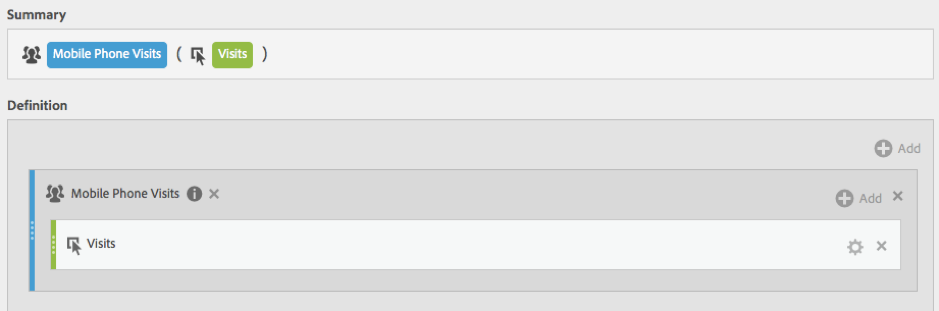
When your segment is ready, go the the segment builder either via the Calculated Metric manager (Components -> Manage Calculated Metrics) or via the Add Metric menu in any of your reports.
Your new calculated metric should be defined as following:
To setup a similar calculated metric for desktop traffic, go over the same steps again using your desktop segment.
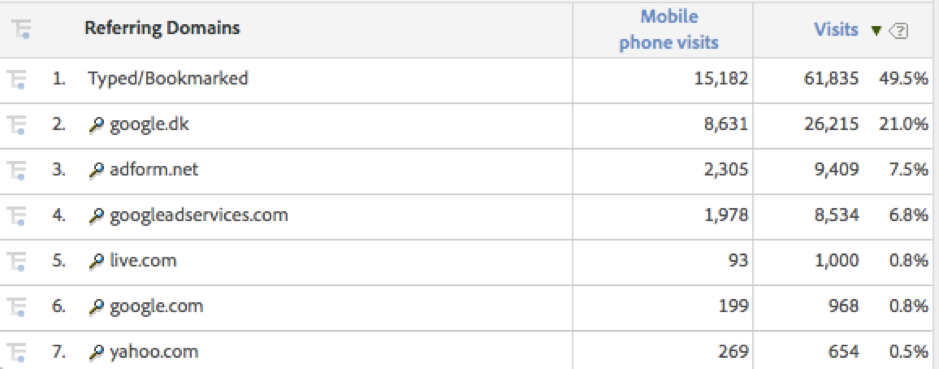
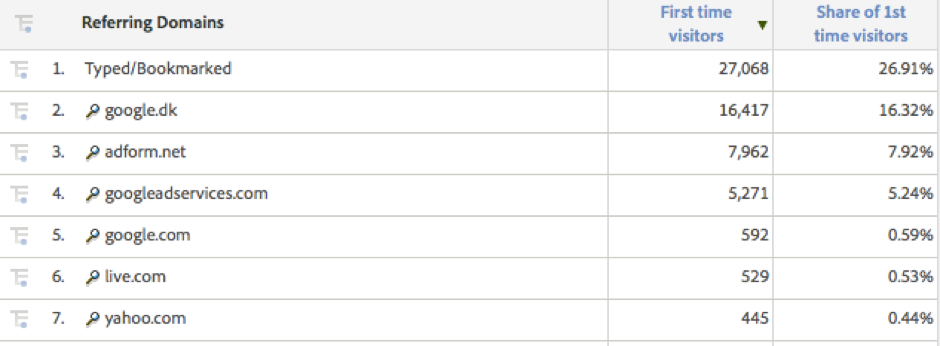
Now you are ready to use your new calculated metrics to improve your reporting, for example by adding those metric to your traffic source reporting or the pages report.
Another simple example of adding value to your reports by using this new feature would be to create a calculated metric showing you New Visitors. By having a metric only holding new visitors, you can easily identify what content new visitors engage or from what source new visitors are acquired from.
You could also change this metric to show you the percentage of new visitors to your site, helping you to follow your user acquisition over time or evaluate campaigns to understand if they engage existing users of your site or acquire new traffic.

The calculated metric uses the COLUMN SUM function, as we want to calculate the share of first time visitors from each referring domain.
In our next blogpost about calculate metrics, we will cover some more advance use cases and examples of how the new calculated metric can enrich your reports and analysis.
in Danish