in Danish
If you are looking to optimize your site and grow your business, Google Analytics may prove a treasure trove. But having made data available for use as input to machine learning and artificial intelligence algorithms – ML and AI – is far from trivial. However, it is certainly not impossible either. It just takes a few tricks. Read this first blog post in our new series on Google Analytics, ML and AI to learn what they’re about.
Just before Christmas one of our clients came to us with a challenge: he runs a large Danish portal site and wanted to know if using ML and AI could help him identify what characterizes “good” client journeys on the site – i.e. how a user travels through the site, which searches he performs, what he clicks along the way etc.
How to get more people to click away
With such knowledge, our client would be able to adjust and optimize his site. He would be able to accommodate the site to the actual behavior of users, improving the chances of users doing what he most wanted them to. These most wanted actions consisted of users clicking on exit links and moving on to partner websites – an activity which triggers a referral fee from the partner to our client, constituting our client’s primary revenue stream.
AI and ML analysis of your Google Analytics data can help you predict how to promote the user behavior that best supports your business goals.
Using ML and AI in this way could provide our client with predictive insights which would help him predict what to do to have users exit clicking even more. And thereby potentially helping him making a lot of money.
The User ID is missing from Google Analytics
The problem we solved, 1: Before we could get the predictive analyzes up and running, we had to solve a serious problem: that Google Analytics stores the data in a way nowhere good enough for ML / AI purposes. The ML / AI methodology is based on a number of algorithms being able to traverse large volumes of detailed data sets to find patterns hidden from plain sight. Exercises Google Analytics can’t handle – at least not out of the box.
On the contrary, Google Analytics by default only allows aggregate numbers to be extracted which does not allow for single-user analysis. Although Google Analytics traces everything that all users do, you can only pull out data based on the total number of users – or segments hereof – who have e.g. clicked on x, y or z. Data on the behavior of individual users of the site are simply not accessible. The User ID, which is needed for this purpose, is simply not accessible.
Custom dimensions implemented in Google Tag Manager
The way we solved it, 2: Although Google Analytics does not by default provide any kind of user ID in the data extract, there’s still a way for you to extract behavioural data on an individual level. You just must add the UserID yourself. And the means for this is through utilizing the Google Analytics “Custom dimensions”.
“Custom dimensions” is a concept for things you can set up for yourself to measure – in addition to the dimensions which Google provides out of the box, such as the device category, page name and traffic source, all of which are available in the standard version of the Analytics interface.
Normally, a custom dimension is used to collect and analyze data that Analytics does not automatically trace. But custom dimensions can also be used more simply. So that was what we did: we set up ClientID as a custom dimension. And voila, every call the Analytics server received was now stamped with a unique user ID that allowed you to dive into the details of what individual users had clicked on, and what other actions they had performed on the site.
Setting a ClientID to the records was not quite enough, though. Google Analytics also lacks another important piece of information: a timestamp that allows you to see when each call has been sent. Therefore, we implemented a Hit Timestamp as our custom dimension number two.
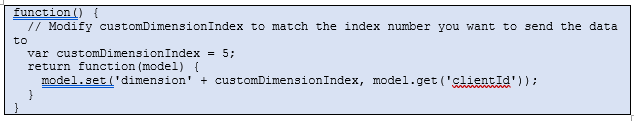
Here’s how the first part of the Custom Dimension code looks like in Google Tag Manager. The code is reviewed in a later blog post.
We implemented the two custom dimensions as tags through the Google Tag Manager. The tag “stamps” every user and every action he makes with our two new custom dimensions, so we can follow the user’s journey through the site. Strictly speaking, we could have done it without the Tag manager too – but the Tag Manager makes implementation much simpler and more straightforward.
Sampled data will not work
The problem we solved, 2: Before we could move on, there was another stumbling block in Google Analytics that we were going to need to overcome. If there is a lot of traffic during the period you want to analyze – ie. data based on over 500,000 sessions – Google Analytics uses so-called “sampled” numbers where numbers are only approximated. And that’s a problem.
Sampled numbers mean that instead of giving you all the data, Google Analytics makes estimates based on small, but significant samples. This may be OK if all you want to know is e.g. how many users have seen which page on the site. But it does not matter when our purpose is precisely to be able to analyze data on each and every individual user of the site.
Download and analyze unsampled data i R and Python
The way we solved it, 2: Of course, the problem could be avoided by choosing to extract data for a period of time that is short enough to not contain more than 500,000 sessions. And then, when done, extract data for the next short period, and so on, until you have pulled out enough data to adequately feed your ML and AI algorithms. But doing this by hand it is a lot of manual work and very inflexible.
Therefore, we chose to completely disregard Google’s standard features and instead code our own extracts with all the data we needed for each user. Unsampled and complete with Client ID and Timestamp.
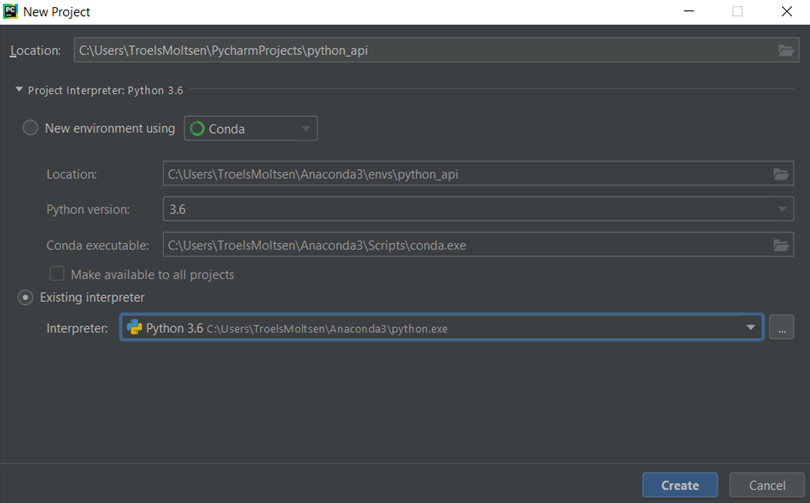
With Python, you can extract unsampled data from Google Analytics. Here is a screen shot from the project creation in PyCharm, which is reviewed in a later blog post
You can encode such an extract in different code languages as R or Python. We used Python – especially because with Python it is possible to extract with the desired structure for a full day at a time. For larger websites a full day of data can account to far more than 1,000,000 rows of data. Additionally, Python is significantly faster than R. In Python the extract-job only takes five to ten minutes to run. In R, the same extract took half an hour.
Having extracted user ID and time stamp enriched individual-level data, we could proceed with the actual analysis, using R to conduct ML and AI to find patterns in the now nicely formatted data.
Hands-on code review on the way
How we more precisely took care of retrieving data with Python, how we used R to analyze data and how we got data prepared with Custom Dimensions and Google Tag manager, I will come back to in a number of other blog posts.
in Danish